Area Measurement - Vertices - Sides (ZID, ZIDS, ZIK, ZIKS)
SDBox Design Software - Command guide for area calculation with vertex numbering and side dimensioning
Area Measurement (ZID) ZID
Select an internal point within a closed area (ZID) or select a Polyline or define an area by selecting its points (ZIDS), in which Blocks are drawn with names at each vertex, the sides, and its area with a corresponding table.
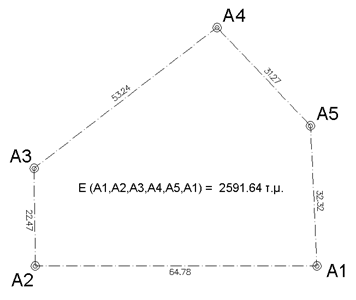
Example of area measurement with vertices and sides
Select point near the 1st vertex of the measurement area [Enter= Select Pline]:
Command Operation
ZID: Select a point inside the closed area and near the vertex from where you want the numbering to start, or select a Polyline (and then the starting point for numbering).
ZIDS: Select point by point (preferably counterclockwise) the area you want to measure.
Note:
The command automatically detects closed areas formed by lines, polylines, or other linear objects. For irregular shapes, use ZIDS to define the area manually.
Calculation Results
Do you want to continue with the measurement data insertion options? Y/N <Yes>:
After area calculation, you're presented with the perimeter, area, and number of vertices. You can then proceed to insert measurement elements into the drawing.
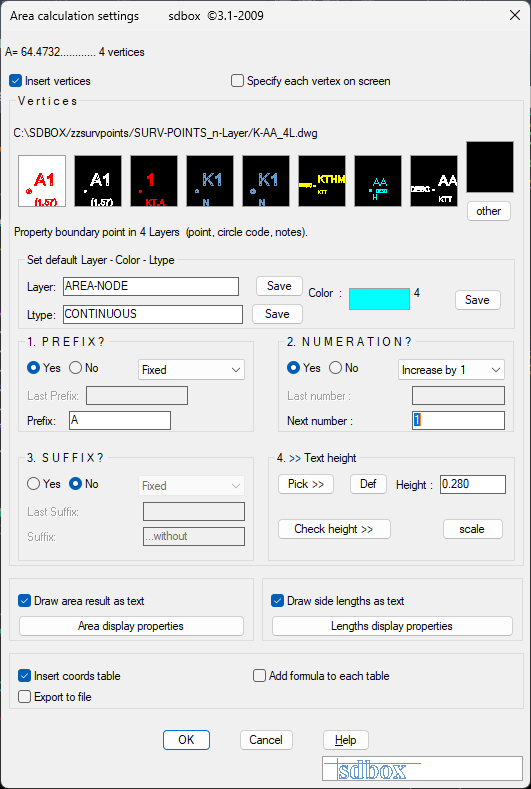
Area measurement configuration interface
^ Back to topPoint Selection (ZIDS) ZIDS
Manual point-by-point selection for area measurement when no closed boundary exists or for irregular shapes.
The ZIDS command allows you to manually define the measurement area by selecting points in sequence. This is particularly useful for:
- Irregular or complex shapes
- Areas without clearly defined boundaries
- Temporary measurement areas
- Verification of automatic detection
Selection Tip:
For accurate area calculation, select points in order (preferably counterclockwise). The command automatically closes the area between the first and last point.
Workflow
- Run ZIDS command
- Select points in sequence defining the area perimeter
- Press Enter when all points are selected
- View calculation results
- Choose insertion options for vertices and sides
Typical Usage:
ZIDS is commonly used in topographic surveys where property boundaries are not clearly defined by continuous lines, or for measuring sub-areas within larger plots.
Vertex Blocks Configuration
Configure the Blocks that will be inserted at each vertex of the measured area.
From the configuration dialog, you define the elements of the Blocks that will be inserted at each vertex. All suggested Blocks, except for the vertex numbering Attribute, also have a 2nd Attribute where you can write the vertex elevation or notes (boundary marker, unmarked vertex, etc.).
The 3 basic Blocks for vertices have the following differences:

Type 1: Contains 4 Layers (point, small circle, attribute for vertex numbering, and attribute for vertex description).

Type 2: All elements are in 1 Layer and does not have a small circle.

Type 3: Includes in 1 Layer all elements of the first type.
Additional Settings
You can also make settings for displaying the area and sides:
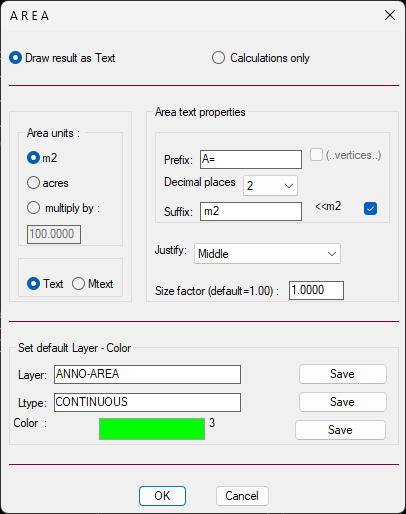
Settings for area and side labeling
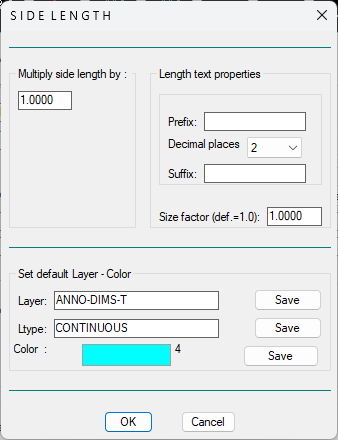
Additional configuration options
Layer Selection:
You can select different layers for vertices, sides, area text, and the summary table. This allows for better organization and control of visibility in your drawing.
Results & Area Labeling
Automatic insertion of vertices, sides, and area label with optional summary table.
After closing the dialogs and selecting the corresponding Layers, the vertices and sides are automatically inserted, and you give the final position for the area label.
If there are already drawn vertices in the area you selected, the program suggests not inserting new ones in their place. This functionality serves the measurement of adjacent areas:
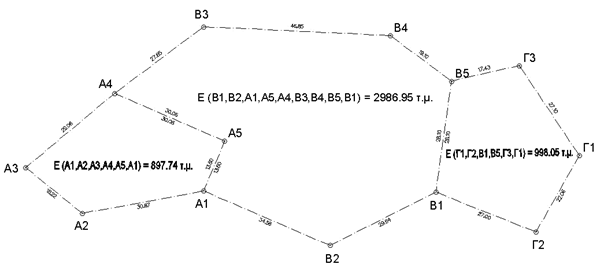
Measuring adjacent areas without duplicate vertices
Important:
If you already have drawn vertices in an area, you can run ZID to insert only the area with the sequence of vertices as they are drawn without inserting new ones.
Summary Table
You then have the ability to insert a vertices coordinate table with a Title of your choice, number of vertices, perimeter, and the area.
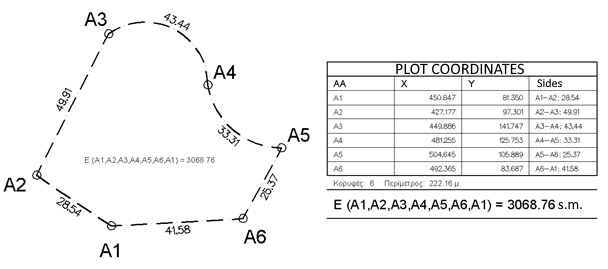
Vertices coordinate summary table
Practical Application:
This feature is particularly useful for survey documentation, property plans, and legal descriptions where a formal table of coordinates is required alongside the graphical representation.
Building Vertices (ZIK/ZIKS)
Building vertices for Topographic or Cadastral surveys with automatic numbering and Block insertion.
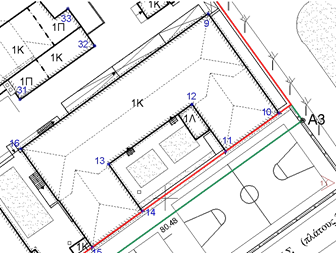
Building vertices measurement
You can insert building vertices in three ways:
ZIK
Select an internal point of a closed Building area where Blocks with names are drawn at each vertex. (Insertion and numbering are done automatically).
ZIKS
Select Building points and Blocks with names are drawn at each vertex. (Insertion and numbering are done automatically).
ZZK
Insert Building vertex Blocks into the Drawing with multiple naming possibilities during insertion and drawing on screen (and export to file capability).
For BUILDING VERTICES TABLE: ZPIK
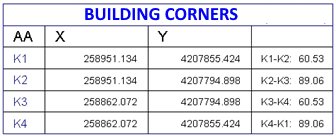
Building area measurement example
Survey Tip:
For cadastral surveys, use ZIK for complete building footprints and ZIKS for partial or complex building outlines. The automatic numbering ensures consistency across survey documents.
Compatibility:
These commands are designed to work with standard topographic and cadastral survey workflows, producing output compatible with survey software and regulatory requirements.