Survey Plan Tools
SDBOX command reference for survey point handling, point-based drafting, coordinate tables, areas and survey plan production inside CAD
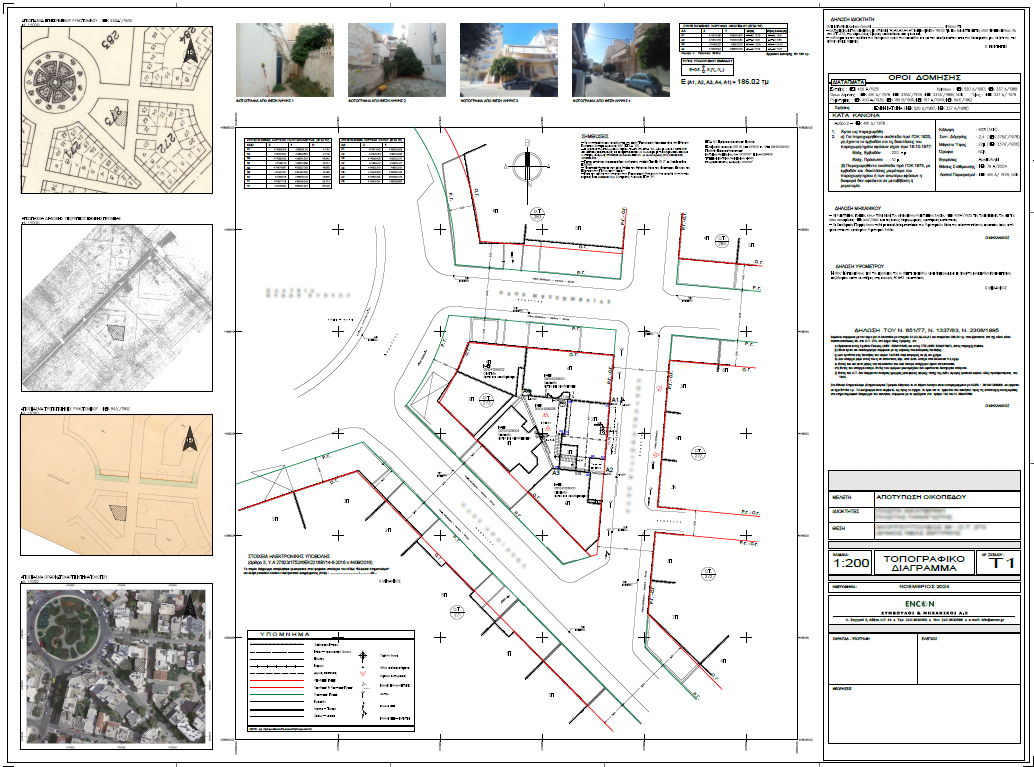 Complete Topographic Plan
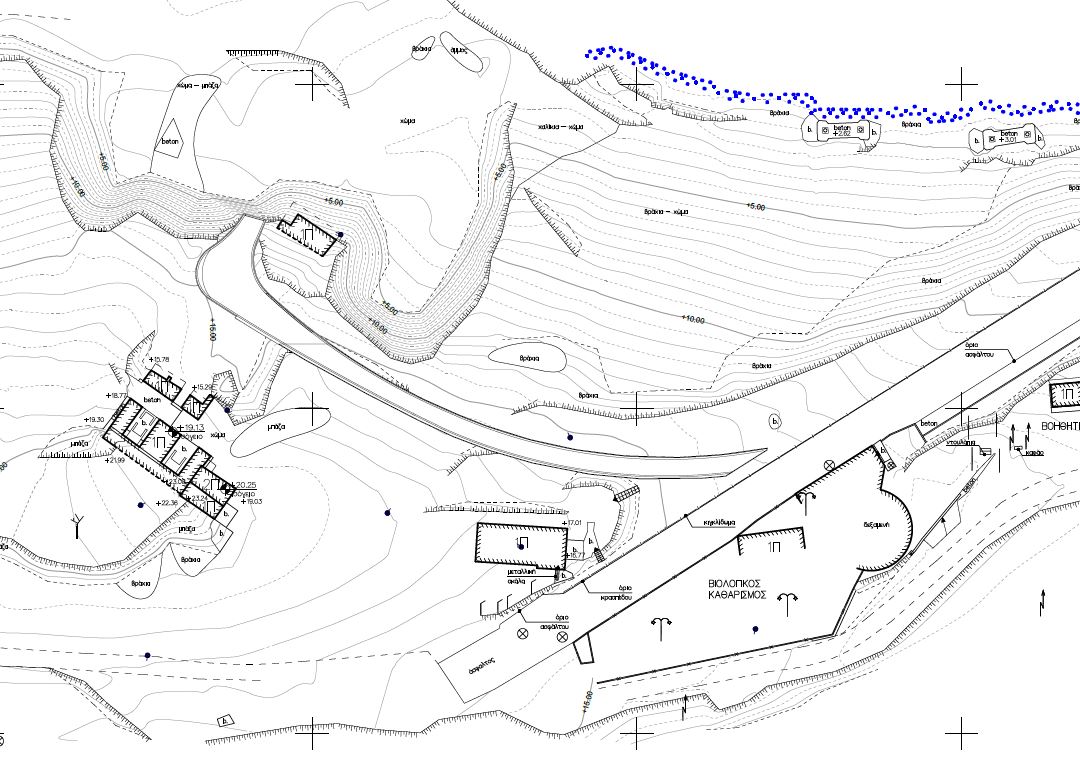 Contours & Terrain
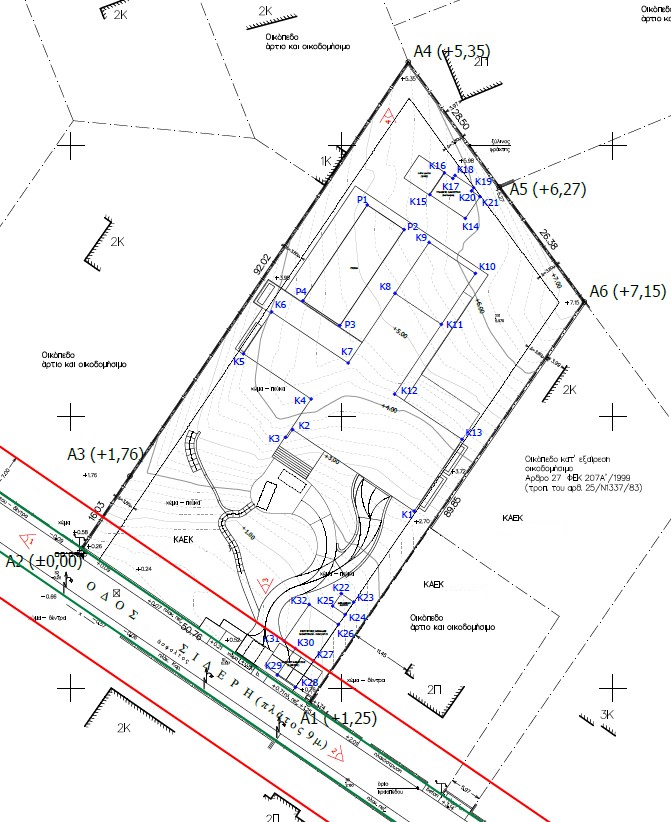 Boundaries & Road Network
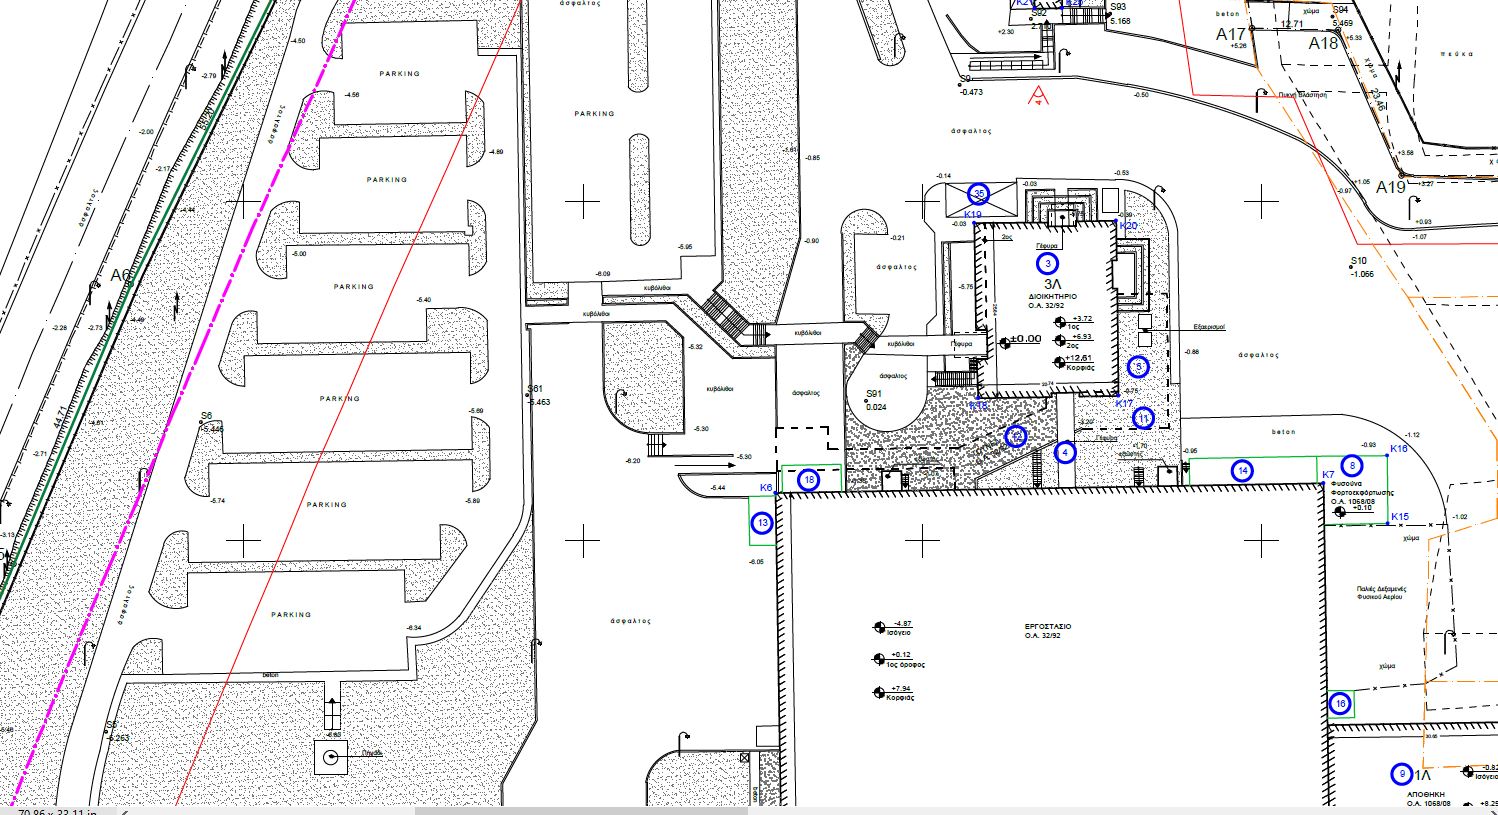 Georeferenced Images & Drawing Inserts
Step-by-step survey drafting guide: Download PDF
Survey Units Setup TOPOUNITS
Sets the unit and angle conventions used by SDBOX survey-drawing commands.
For the survey convention used here, the Y axis is at 0.0000g and the X axis at 100.0000g.
The following are defined:
- Coordinate display format
- Linear and angular units
- Precision settings
- Scale factor for EGSA grid
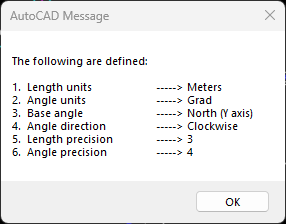
Survey units configuration interface
Tips:
Use this command when preparing a survey drawing so the related SDBOX commands use consistent units, angular settings and precision.
Import Objects from Coordinate File ITAX
Imports point symbols (blocks) or other block-based objects from a coordinate file.
Supports different coordinate-file layouts and lets you define how the imported values are assigned to block attributes.
Coordinate file import interface (click image for details)
Usage:
Use this command to import processed coordinate data as survey points, control points or other block-based objects.
3D Points Notification Update 3DLL
Controls whether SDBOX warns you when a selected point has a non-zero Z value in commands that use this option.
The same setting is also available in the ZLL command.

3D points notification settings
Note:
Use the warning when you want to be alerted that a selected point contains elevation information instead of Z=0.00.
Drawing Elements Update with Points DMLL
Defines which blocks and attributes SDBOX uses to identify point codes when you type a point name during drafting.
The same point-recognition settings are used by ZLL and other commands that accept typed point codes.
Run this command after inserting new point blocks, or whenever SDBOX does not recognize point codes in the current drawing.
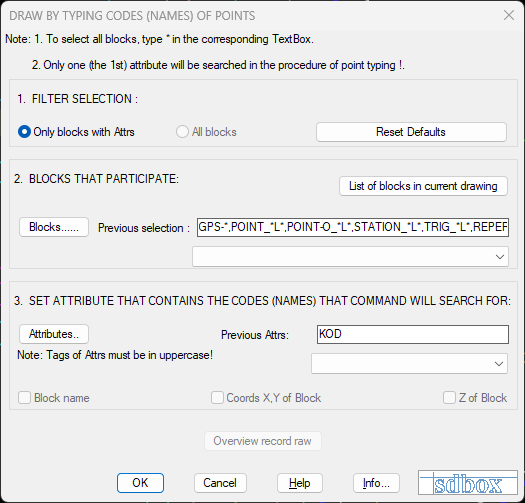
Drawing elements configuration for point-based drafting (click image for details)
^ Back to topRectangle with 3 Points MR3
Creates a rectangle from three consecutive points, selected on screen or entered by point code.
How it works
Select three consecutive points on screen or enter their point codes. SDBOX creates the corresponding rectangular polyline.

Rectangle created from 3 points
Note:
Useful for quickly creating rectangular building footprints or other rectangular geometry from known survey points.
Usage:
Use it when the required rectangle is defined by existing survey points and you want to avoid drawing each side manually.
Tips:
When typing point codes, use the automatic point search feature to quickly locate existing survey points in your drawing.
Command Sequence
Select or type 1st point:
Select or type 2nd point:
Select or type 3rd point:
Rectangle with 2 Points MR2
Creates a rectangle from two opposite corner points, selected on screen or entered by point code.
How it works
Select two opposite corners on screen or enter their point codes. SDBOX creates the rectangular polyline defined by those corners.

Rectangle defined by diagonal corners
Note:
This is the quickest option when the two opposite corners of the required rectangle are already known.
Usage:
Useful for rectangular geometry when the two diagonal corner points are available.
Tips:
The rectangle will be created parallel to the current UCS (User Coordinate System). Ensure your drawing orientation is correct before using this command.
Command Sequence
Select or type 1st corner point:
Select or type opposite corner point:
Spline with Points MSP
Creates a spline through points selected on screen or entered by point code.
How it works
Select points on screen or enter their point codes in sequence. SDBOX creates a spline passing through the selected points.

Spline curve created through multiple points
Note:
Useful for smooth irregular features such as curved boundaries, road edges or other surveyed linework.
Usage:
Use it where a smooth curve through a sequence of survey points is required.
Tips:
You can continue adding points until you press Enter. Use Undo (U) option to remove the last point if needed.
Point construction options
^ Back to topCircle with 3 Points MK3
Creates a circle through three points selected on screen or entered by point code.
How it works
Select three non-collinear points on the screen or type their point codes. The command creates a circle passing through all three points.
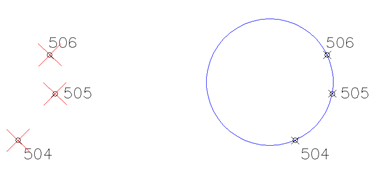
Circle defined by 3 points on its circumference
Note:
The three points must not be in a straight line. The circle will be drawn regardless of the points' order.
Point construction options
^ Back to topCircle with Center+Radius MKK
Creates a circle from a center point and radius; the center can also be entered by point code.
How it works
Select the center point (or type its code) and then specify the radius by selecting a second point or typing the radius value.
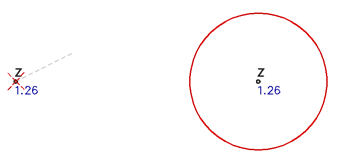
Circle defined by center point and radius
Tips:
You can type the radius value directly or pick a point to define the radius graphically. When typing point codes for the center, use the automatic point search.
Arc with 3 Points MJL
Creates an arc through three points selected on screen or entered by point code.
How it works
Select three points: start point, second point (on the arc), and end point. The command creates an arc passing through all three points.
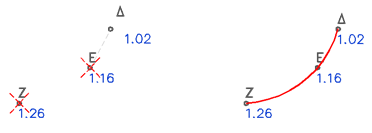
Arc defined by 3 points
Note:
Useful for curved features that are defined by three known survey points.
Point construction options
^ Back to topInsert Images for Fitting or Excerpt ZIMIN
Inserts a raster image and can organize it on dedicated layers for background alignment or for use as an image extract within the drawing.
How it works
- Select the image you want to insert. For grayscale source material, a black-and-white version can be useful when you want a lighter background and clearer linework.
- Specify whether the image is black and white. SDBOX uses this choice when creating the corresponding image layer.
- Choose whether to create a dedicated layer when the image will later be used as a drawing extract.

Image insertion interface
Note:
The command is intended for raster backgrounds that need to remain organized separately from the main CAD geometry. Images can be placed on dedicated layers so they are easier to manage, align, display behind the drawing and reuse as drawing extracts.
Tips:
Use clear image filenames before insertion, because the generated layer names can reflect the image names and make larger drawings easier to manage.
See also: ZIMGEO (Automatic insertion of georeferenced images)
^ Back to topGrid Drawing KNB, KNBS
Creates a coordinate grid for survey drawings, with spacing adapted to the current print scale.
KNB vs KNBS
KNB: Select two points that define the area; grid crosses are created using spacing appropriate to the print scale.
KNBS: Select two points and SDBOX creates the frame, grid, corner coordinates and grid-step labels on all four sides.
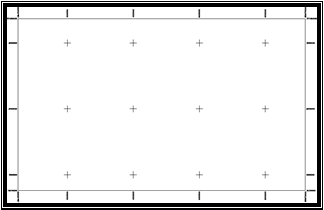
KNB (left) vs KNBS (right) grid creation
Usage:
Use KNB for a simple grid, or KNBS when you also need a complete frame with coordinate information and grid-step labels.
Tips:
The grid spacing automatically adjusts based on your drawing's print scale. For larger scale drawings (more detail), the grid spacing will be smaller.
Grid Coordinate Annotation KNBT
Adds coordinate labels to selected grid intersections.
How it works
Select grid intersection points and the command automatically places coordinate text at those locations.
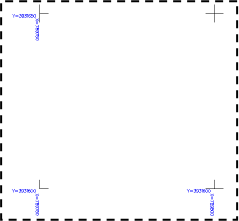
Automatic coordinate annotation on grid points
Note:
You do not need to snap manually to the exact grid intersection; the command identifies the grid vertex automatically. Text height is adjusted to the drawing scale.
Tips:
Use this after creating your grid with KNB or KNBS to automatically label coordinates at important grid intersections.
Building Hatch (Open Area) PHKT
Creates the building indication line along points you specify, offset toward the building interior.
How it works
Select points along the building outline. SDBOX creates the corresponding dashed building line on the interior side.
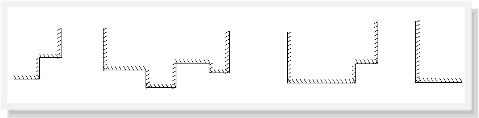
Building hatch pattern for open (unclosed) areas
Note:
If the dashed line pattern is not displayed correctly after zooming or panning, run REGEN to refresh the drawing.
Usage:
Use this version when the building outline is not a closed boundary and you want to define the indication line point by point.
Building Hatch (Closed Area) HKT
Select a point inside a closed boundary and SDBOX automatically creates the building indication line along its interior.
How it works
Pick a point inside a closed boundary. SDBOX detects the boundary and creates the corresponding dashed building line on the inside.
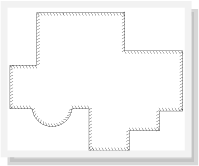
Automatic building hatch inside closed areas
Note:
If the dashed line pattern is not displayed correctly after zooming or panning, run REGEN to refresh the drawing.
Tips:
Useful when a closed building footprint already exists and you want to create the building indication without tracing it manually.
Copy to Point MCC
Copies selected objects repeatedly to destination points selected on screen or entered by point code.
How it works
Select objects to copy using filter-based selection, then specify multiple destination points by either picking on screen or typing point codes.
Filter-based object selection (click image for details)
Object Selection:
Select the objects to copy using the available object filters.
Using typed point codes
You can define which point blocks are recognized and which block attribute contains the point code used during the command.
3D point warning
When this option is enabled, SDBOX warns you if a selected point has a Z value other than 0.00.
Point construction options
View the available point construction options
Note:
Select the copy base point on screen before placing the objects at the destination points.
Offset to Point MOF
Creates an offset using points selected on screen or entered by point code.
How it works
Select an object to offset, then specify offset distance and side by picking points or typing point codes.
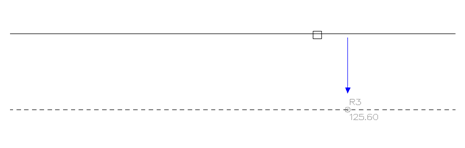
Offset operation using point codes
Note:
Useful when the offset direction or position is related to known survey points.
Usage:
Typical uses include parallel construction lines, setback lines and other offsets referenced to surveyed geometry.
zzDistance ZDD
Measures successive distances and reports each result in the command line; points can also be entered by code.
How it works
The command is similar to CAD DIST, but it continues for successive measurements, keeps the results visible in the command line and can warn when a selected point has a non-zero Z value.
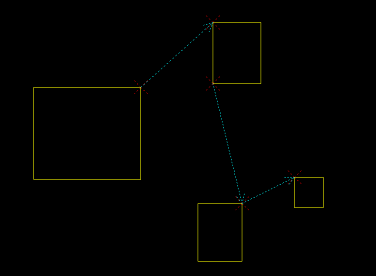
Continuous distance measurement with reporting
Command Sequence
Give 1st point for 1st Distance? :
Give 2nd point for 1st Distance? [U=Undo]:
.... A: 15.858m. Give 1st point for 2nd Distance? [U=Undo]:
.... A: 15.858m. Give 2nd point for 2nd Distance? [U=Undo]:
.... A: 15.858m. B: 13.115m. Give 1st point for 3rd Distance? [U=Undo]:
Note:
Continue for as many measurements as needed; the previous distance results remain reported in the command line.
Tips:
Useful for quick verification of multiple distances in a sequence without having to write them down separately.
Building Characteristic Text XKT
Inserts building-description text selected from a predefined dialog.
How it works
Select the required building description from the dialog and place the text at the required location in the drawing.
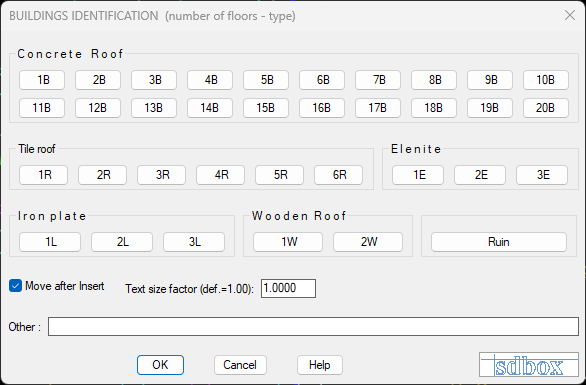
Building characteristic selection dialog
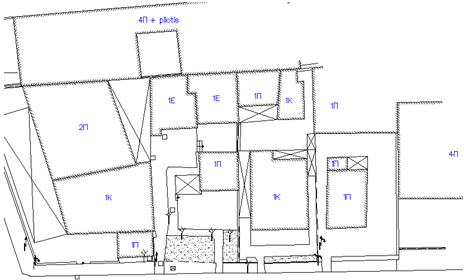
Building characteristic text placement
Usage:
Provides consistent building annotations while avoiding repeated manual typing.
Tips:
The available entries can be customized to suit the terminology used in your projects.
RG OG Indication Text RGOG
Creates text annotations for planning and building lines using the selected geometry and offset information.
How it works
Select the start point, annotation direction and the side toward the property interior. Where an offset is provided, SDBOX can also place the corresponding building-line annotation.
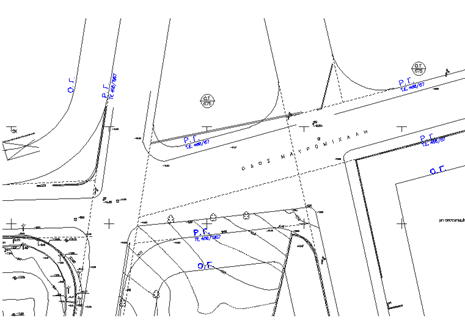
RG (Planning) and OG (Building) line annotations
Command Sequence
Enter Layer for 'RG-OG Indications':
Select START point (corner) <U=Undo, ENTER=Exit>:
Select DIRECTION for annotation <ENTER=Undo>:
Give point toward property interior <ENTER=Undo>:
Enter or measure on screen the Green Zone width <ENTER=Undo>:
Enter Text (for FEK, T.E. or D.E. below RG line):
Note:
If the first two points define the planning line, the corresponding building-line annotation can also be created when the required offset width is provided.
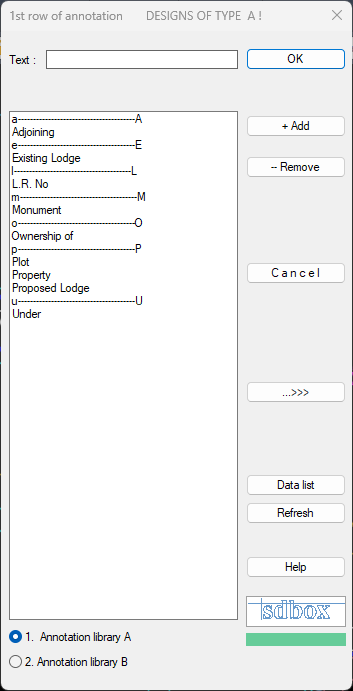
Text options for additional information (click image for details)
Tips:
Optional secondary text can be added below the planning-line annotation for project-specific references or notes.
Select the required line type. Details
Property Area Calculation (Vertices, Sides & Area) ZID, ZIDS
Select an interior point of a closed area or an existing polyline with ZID, or define the area point by point with ZIDS. SDBOX places a named block at each vertex, annotates the side lengths, and calculates and inserts the area.
ZID vs ZIDS
- ZID: Select a point inside a closed area, or select an existing polyline.
- ZIDS: Define the area by selecting its boundary points.
The resulting property area is documented directly in the drawing with named vertex blocks, side lengths and the calculated area.
Open Area Calculation Guide ^ Back to topCoordinate Tables ZPID, ZPPOL, ZPRP, ZPTR, ZPBL
Creates a drawing table containing the selected block names/codes, coordinates and elevations.
How it works
The command variants use the same workflow. Each variant stores its own suggested block types, attributes and table title for reuse.
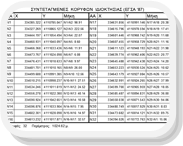
Coordinate table creation interface (click image for details)
Command Variations:
- ZPID: Property vertices coordinates
- ZPPOL: Polygon vertices coordinates
- ZPRP: Benchmark / control-point coordinates
- ZPTR: Survey control-point coordinates
- ZPBL: Block coordinates
Table from File ZPFL
Select a data file and column separator, and SDBOX creates a table from the file contents.
How it works
Use delimited text data to create a CAD table made from drawing text and linework.
Details about file import and table creation
Note:
Common separators include comma, tab and semicolon; other separators can also be specified. Table text and spacing follow the relevant drawing settings.
Usage:
Useful for coordinate lists and other tabular information that needs to be presented directly in the CAD drawing.
Export Coordinates to File ZXID, ZXPOL, ZXTAX, ZXREP, ZXTRI
Exports selected block data to a coordinate file, with one object per row.
How it works
The command variants use the same export workflow. Each variant stores its own suggested block types, attributes and output settings for reuse.
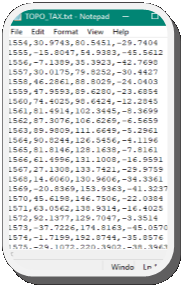
Coordinate export interface (click image for details)
Command Variations:
- ZXID: Export property vertices
- ZXPOL: Export polygon vertices
- ZXTAX: Export survey points
- ZXREP: Export benchmark / control points
- ZXTRI: Export survey control points
Elevation Points in Section View MKO
Projects selected survey points onto a section axis defined by its left and right endpoints.
How it works
The process is as follows:
- Select the left and right endpoints that define the section axis.
- Select the output file and the point blocks to project. Their position relative to the section axis is calculated and written to the file.
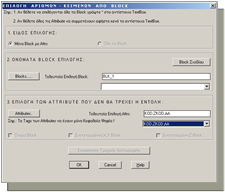
Point selection for section projection (click image for details)
Note:
The first time MKO is used in a drawing, a dialog lets you define how point blocks and point-code attributes are recognized when entering point names.
Command Sequence
Give 1st Point (LEFT) for 'Point projection in section'? :
Give 2nd Point (RIGHT) for 'Point projection in section'? [U=Undo, S=Series, K=Constructions]:
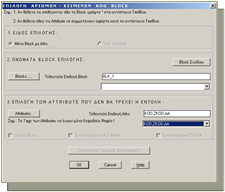
Export file configuration (click image for details)
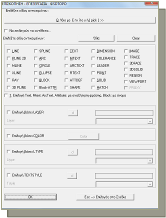
Filter-based object selection (click image for details)
Tips:
After the export is created, it can be imported into a drawing with ITAX using Custom Blocks → SHM-OPSHS.
Each output row has the form CODE, X, Y, Z, L, where L is the point distance from the section axis.
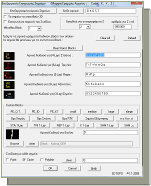
Import projected points with ITAX command (click image for details)
^ Back to topDeclarations, Notes, Remarks TITLOITOPO
Provides ready-to-use drawing content for titles, notes, planning/building parameters, statements, declarations and remarks used in survey plan production.
How it works
Lets you insert prepared title and documentation content without recreating the same text for every drawing. The supplied entries can also be managed and extended with project- or office-specific content.
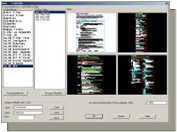
Standard survey declarations and notes (click image for details)
Includes:
- Statements and declarations
- Planning and building parameters
- Project and drawing information
- Notes and remarks
- Ready-to-use title and documentation elements
- User-managed and user-defined entries
Usage:
Use it when completing the documentation and annotation of a survey plan, selecting only the entries required for the current project.
Survey Control Point Detail EXASF
Creates a documented detail around a selected survey/control point, including a centered viewport, reference lines, dimensions and a description/reference table.
How it works
The command organizes the selected point detail and its surrounding reference information in a consistent drawing format.
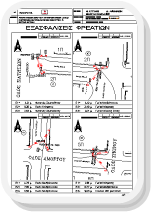
Survey control point documentation (click image for details)
Purpose:
Documents the location of a survey/control point together with the dimensions and references needed to identify it in the drawing.
Usage:
Use it when a project requires a dedicated detail for a benchmark, station or other survey control point.
Project requirements:
The exact information required for control-point documentation depends on the project and applicable local requirements.